|
 |
| |
 |
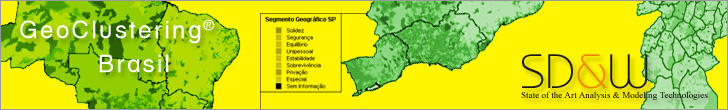
GeoClustering® Brasil |
|
| |
|
| |
GeoClustering® Brazil was carried out with SD&W proprietary models, using more than 1500 variables with information from census and other public databases, calibrated with data from private databases. The population data are updated with proprietary models by SD&W. |
| |
|
| |
To get a thorough explanation about GeoClustering® Brazil, contact us. |
| |
|
| |
 |
| Example: |
|
| |
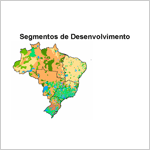
| Brazil. Macro vision. Macro zones development. |
| |
 |
|
|
| |
|
| |
 |
| Example: |
|
| |
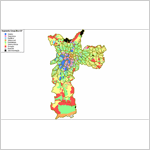
| Sao Paulo. GeoClustering® of the whole city. |
| |
|
|
|
| |
|
| |
 |
| Example: |
|
| |
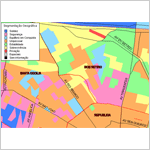
| Sao Paulo. Micro vision. |
| |
|
|
|
| |
|
|
Granularity Options |
|
| |
Every degree of granularity is developed by specific models, which allows performing from macro analysis to micro marketing actions. |
| |
|
|
Macro vision: Brazil |
|
| |
The country as a whole is taken as a universe and the city is the unit of analysis. Approximately 5600 cities are grouped so as to allow different types of macroeconomic analysis for strategic planning. |
| |
|
|
Micro vision: Cities |
|
| |
Detailed information by ZIP code.
GeoClustering® links the information about your customers with information about the market, discriminated by the smallest geographic unit, the 8 digit postal code. |
| |
|
|
This analysis covers the following areas: |
|
| |
• Sao Paulo and the main metropolitan cities
• Rio de Janeiro and the main metropolitan cities
• Belo Horizonte
• Contagem
• Brasilia |
| |
|
| |
GeoClustering® on any other city can be performed on demand. Contact us. |
|
|
|